Quick Answer
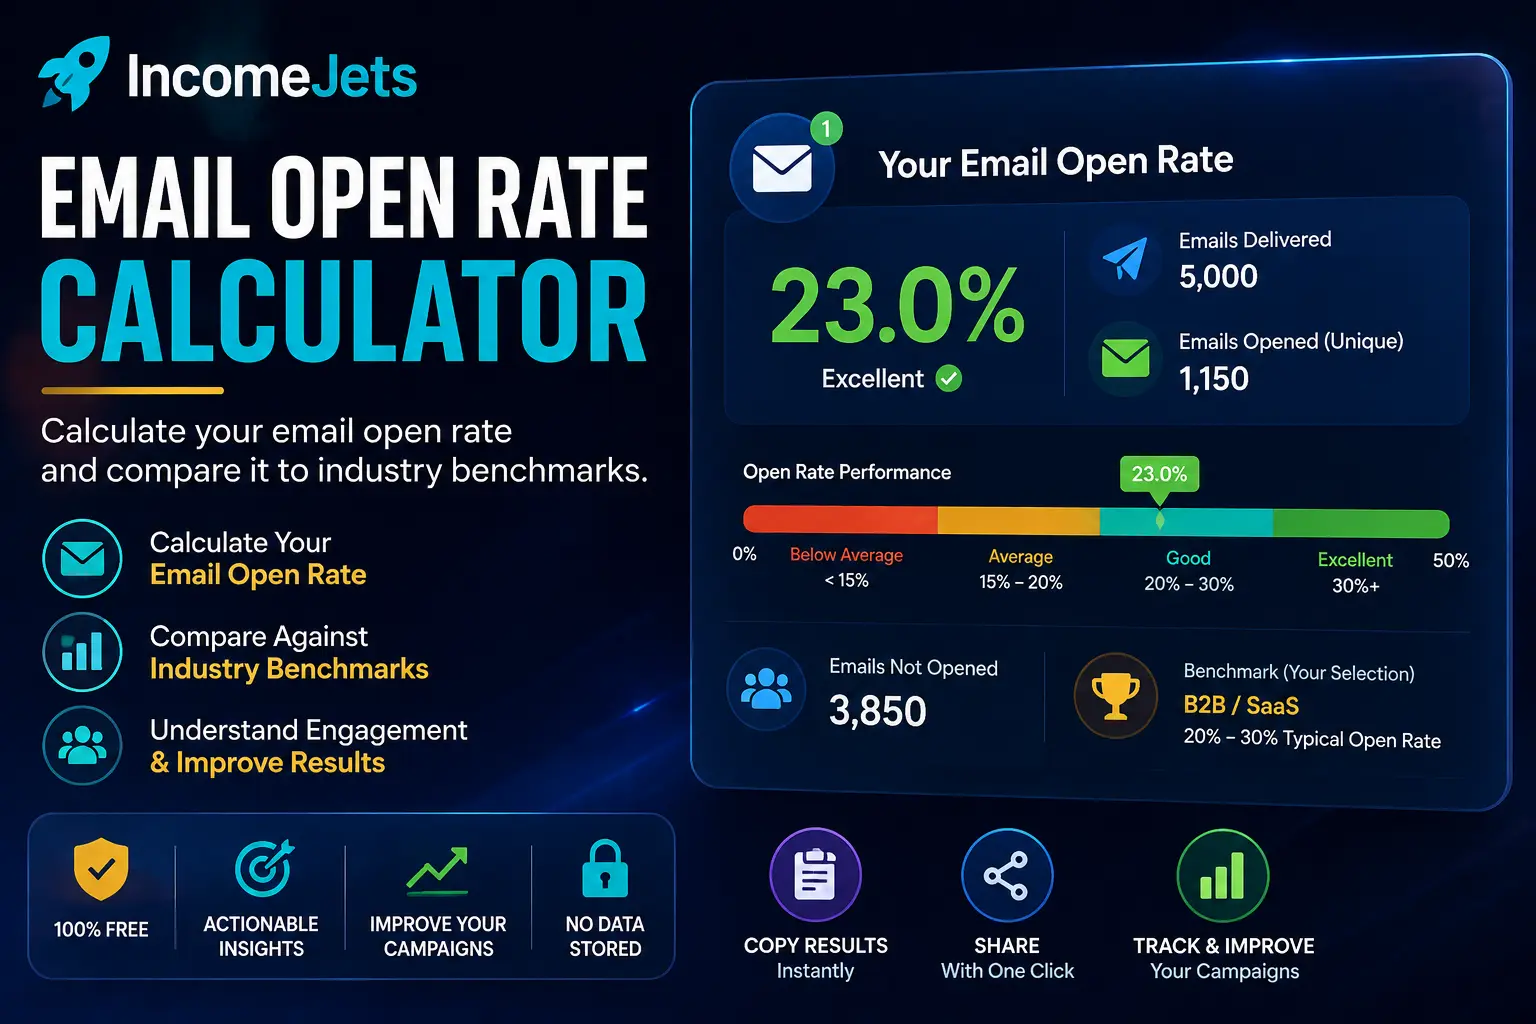
Email open rate is calculated by dividing unique opens by delivered emails, then multiplying by 100. A campaign delivered to 5,000 subscribers with 1,150 unique opens achieves a 23.0% open rate. Whether that is strong depends on your industry, audience, email platform, and historical performance.
vs. Click Rate Calculator: this tool measures how many recipients opened your email. The Click Rate Calculator measures how many went on to click a link inside the message.
How the Email Open Rate Calculator Works
Enter your delivered email volume and unique open count. The calculator divides unique opens by delivered emails for your open rate and shows exactly how many subscribers left the email unopened.
Open rate is one of the first metrics many email marketers review after sending a campaign, as it reflects inbox deliverability, sender recognition, and subject line resonance before a reader ever sees your body copy.
Industry Open Rate Benchmarks
Average open rates fluctuate significantly depending on business model and subscriber intent:
| Industry / Business Model | Typical Average Range | Top Performer Tier | Key Optimization Focus |
|---|---|---|---|
| E-commerce / Retail | 18% – 30% | 30%+ | Promotional urgency, discount previews, & VIP segmentation |
| B2B / SaaS | 22% – 36% | 36%+ | Personalized sender names, pain-point hooks, & plain-text style |
| Media / Publishing | 24% – 40% | 40%+ | Editorial consistency, curiosity gaps, & exclusive analysis |
| General Marketing | 20% – 35% | 35%+ | Sender reputation, preheader alignment, & list cleaning |
Delivered vs. Sent — Why It Matters
Use delivered emails as the denominator when your email platform reports delivered separately from sent. Using total sent emails artificially depresses your open rate by including hard and soft bounces that never reached an inbox.
Open Rate (%) = (Unique Opens ÷ Emails Delivered) × 100
Unopened Volume = Emails Delivered − Unique Opens
Tips for Higher-Converting Open Rates
- Track unique opens over total opens: Total opens count single readers opening multiple times, distorting genuine reach metrics.
- Audit inactive subscribers regularly: Pruning contacts who have not opened in 90+ days immediately protects domain reputation and lifts open rates.
- A/B test preheader text: The preview text alongside your subject line provides a secondary hook that can increase open rates by 3–7%.
- Evaluate the full pipeline: Pair this tool with the Click Rate Calculator to verify that high open rates convert to downstream clicks.
Example Scenarios
5,000 delivered with 1,150 unique opens — a 23.0% open rate representing a healthy, engaged subscriber base.
10,000 delivered but only 800 opens — an 8.0% open rate signaling unengaged subscribers or spam folder placement.
A/B testing two subject lines reveals one pulling 31.0% vs 19.0%, isolating the impact of curiosity hooks.
A win-back email to dormant subscribers yielding 12.0% opens, identifying exactly which contacts to keep or purge.
Frequently Asked Questions
What is a good email open rate?
A typical range across industries is 20%–35%. However, personal newsletter lists often see 35%–45%, while broad e-commerce promotional blasts typically average 18%–25%.
Why are open rates less exact than they used to be?
Email open tracking relies on 1×1 tracking pixels. Security tools and image-blocking clients undercount opens, while privacy systems (like Apple Mail Privacy Protection) pre-load images on servers, inflating counts. Open rates should be tracked as relative directional trends rather than perfect censuses.
Should I use emails sent or emails delivered?
Use delivered emails whenever available. Sent includes bounced addresses that never arrived, which skews your calculation downward.
How can I raise a declining open rate?
Remove subscribers who have not engaged in 3–6 months, test shorter subject lines under 40 characters, and ensure your SPF, DKIM, and DMARC authentication records are properly configured.
If your open rate is healthy, measure what happens after the open with the Click Rate Calculator and project subscriber earnings with the Email Revenue Calculator.